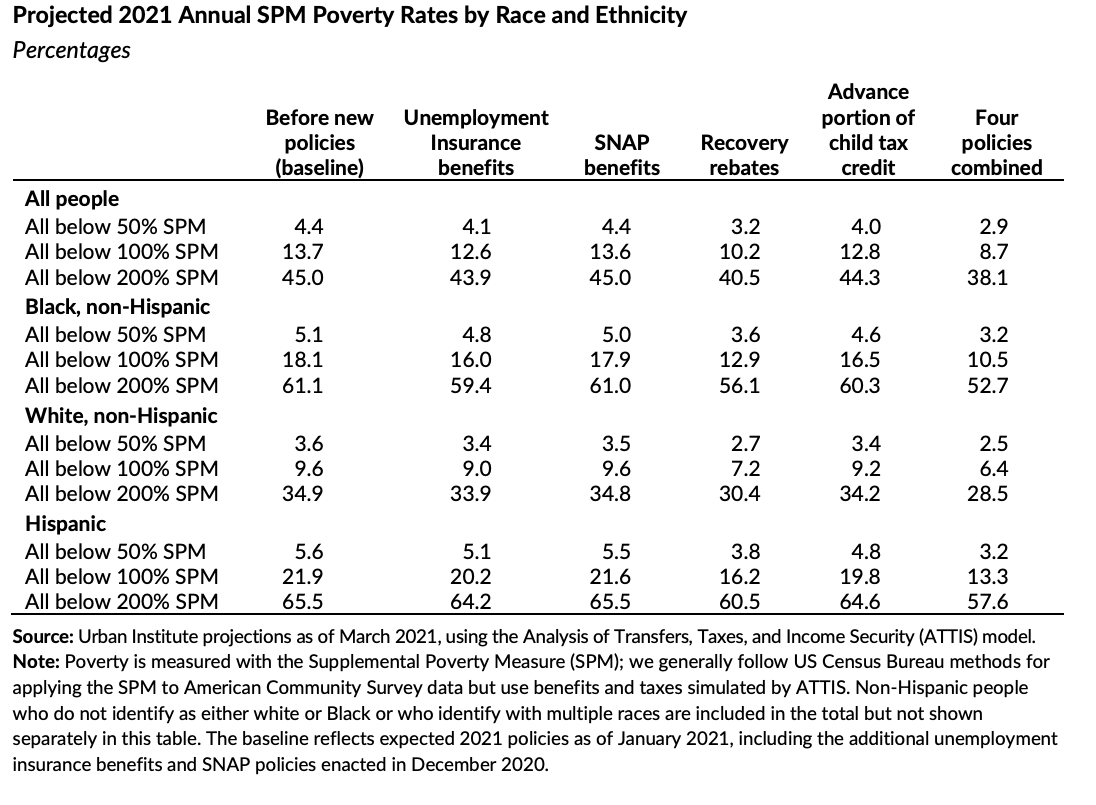
Why do we care about tables?
Why do we care about tables?
Why do we care about graphs?
Why do we care about tables?
Why do we care about graphs?
Both Graphs AND Tables are tools for communication
Why do we care about tables?
Why do we care about graphs?
Both Graphs and tables are tools for communication
Better Graphs/Tables are better communication
A grammar of graphics
ggplot2is an application of the grammar of graphics for R
A grammar of graphics
ggplot2is an application of the grammar of graphics for RA default dataset and set of mappings from variables to aesthetics
- One or more layers of geometric objects
- One scale for each aesthetic mapping used
- A coordinate system
- The facet specification
A grammar of graphics
A grammar of graphics
Images from John-Burn Murdoch's presentation: ggplot2 as a creativity engine
Easy enough to rapidly prototype graphics at the "speed of thought"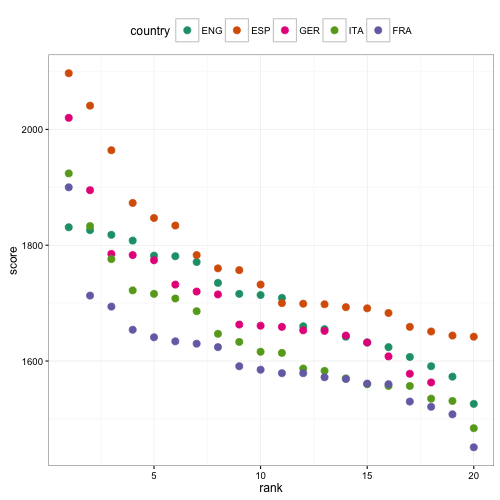
A grammar of graphics
Images from John-Burn Murdoch's presentation: ggplot2 as a creativity engine
Easy enough to rapidly prototype graphics at the "speed of thought"
Powerful enough for final "publication"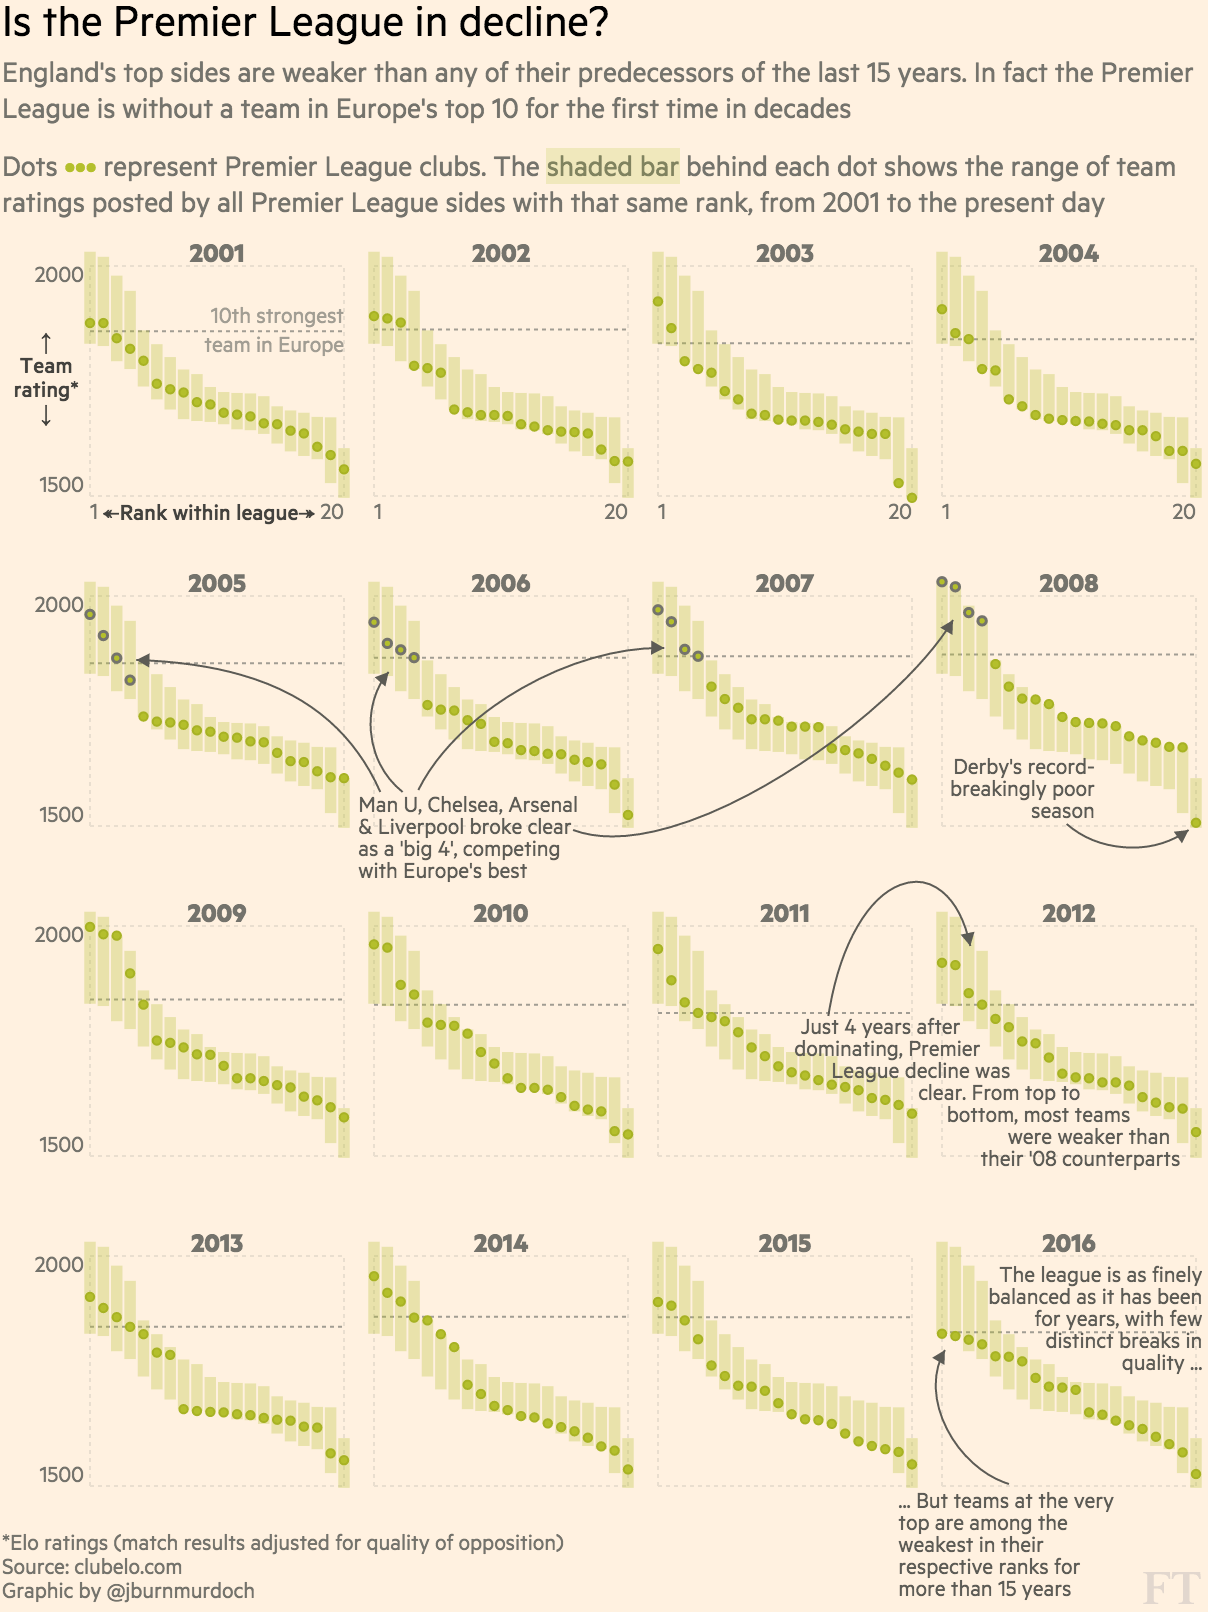
A grammar of tables
A grammar of tables
Construct a wide variety of useful tables with a cohesive set of table parts. These include the table header, the stub, the column labels and spanner column labels, the table body and the table footer.
A grammar of tables
Construct a wide variety of useful tables with a cohesive set of table parts. These include the table header, the stub, the column labels and spanner column labels, the table body and the table footer.
Easy enough to rapidly prototype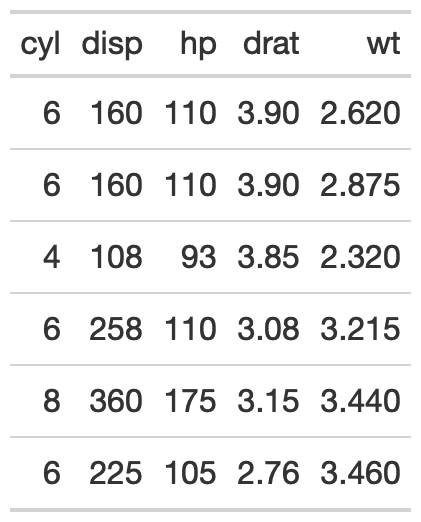
Easy enough to rapidly prototype
Powerful enough for final "publication"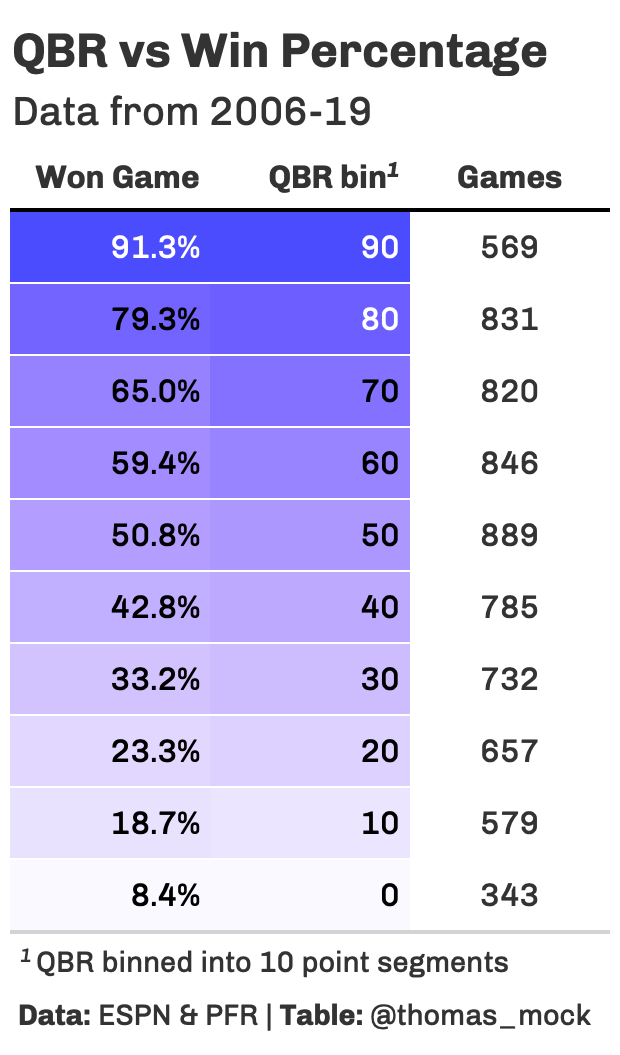
Best practices
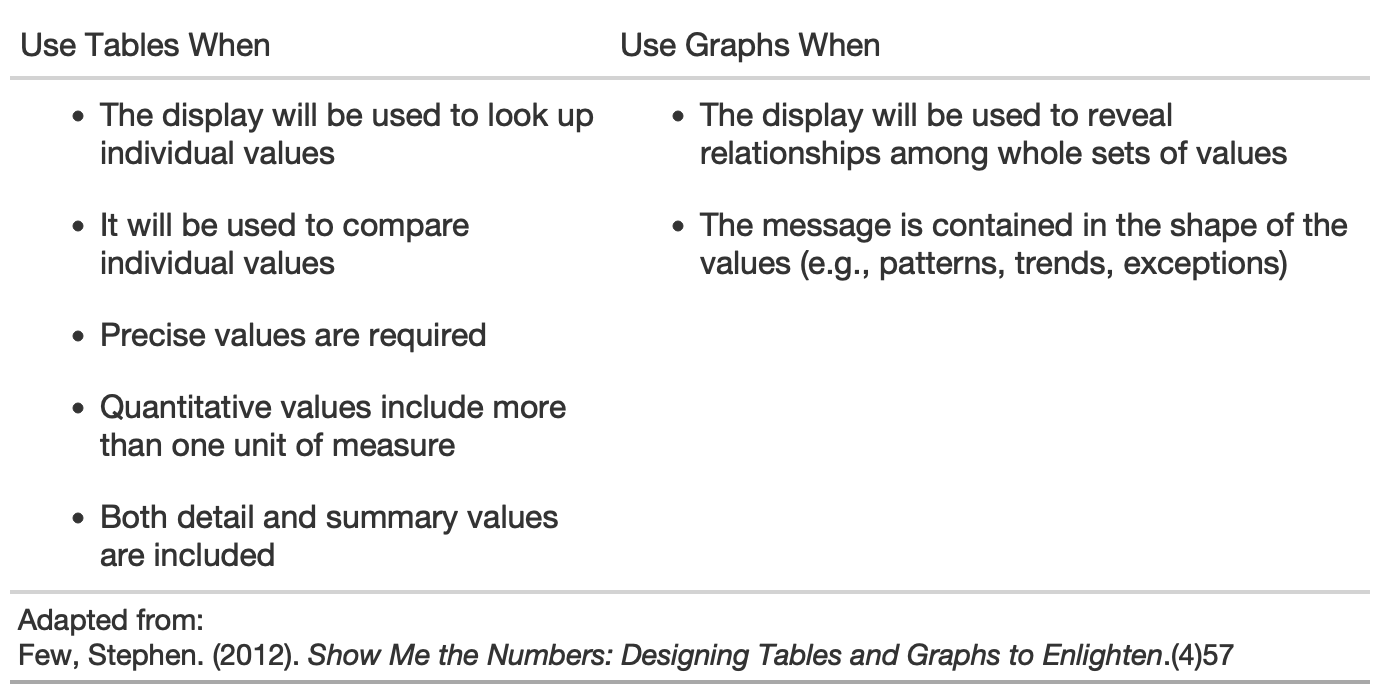

10 Guidelines for Better Tables
H/t to Jon Schwabish!
Adapted to gt in my blogpost.
1. Offset the Heads from the Body
2. Use Subtle Dividers over Heavy Grids
3. Right-Align Numbers
4. Left-Align Text
5. Select Appropriate Precision
6. Guide your Reader with Space between Rows and Columns
7. Remove Unit Repetition
8. Highlight Outliers
9. Group Similar Data and Increase White Space
10. Add Visualizations when Appropriate
#TidyTuesday data
library(tidyverse)library(gt)url_in <- 'https://raw.githubusercontent.com/rfordatascience/tidytuesday/master/data/2020/2020-09-01/key_crop_yields.csv'raw_yields <- readr::read_csv(url_in)yield_data <- raw_yields %>% janitor::clean_names() %>% rename_with(~str_remove(., "_tonnes_per_hectare")) %>% select(entity:beans, -code) %>% pivot_longer(cols = wheat:beans, names_to = "crop", values_to = "yield") %>% rename(Country = entity)yield_data## # A tibble: 78,450 x 4## Country year crop yield## <chr> <dbl> <chr> <dbl>## 1 Afghanistan 1961 wheat 1.02 ## 2 Afghanistan 1961 rice 1.52 ## 3 Afghanistan 1961 maize 1.4 ## 4 Afghanistan 1961 soybeans NA ## 5 Afghanistan 1961 potatoes 8.67 ## 6 Afghanistan 1961 beans NA ## 7 Afghanistan 1962 wheat 0.974## 8 Afghanistan 1962 rice 1.52 ## 9 Afghanistan 1962 maize 1.4 ## 10 Afghanistan 1962 soybeans NA ## # … with 78,440 more rows#TidyTuesday data
country_sel <- c( "China", "India", "United States", "Indonesia", "Mexico", "Pakistan" )yield_data_wide <- raw_yields %>% janitor::clean_names() %>% rename_with( ~str_remove(., "_tonnes_per_hectare") ) %>% select(entity:beans, -code) %>% pivot_longer( cols = wheat:beans, names_to = "crop", values_to = "yield" ) %>% rename(Country = entity) %>% filter( crop %in% c("potatoes", "maize"), year %in% c(2014:2016), Country %in% country_sel ) %>% pivot_wider( names_from = year, values_from = yield )#TidyTuesday data
yield_data_wide## # A tibble: 12 x 5## Country crop `2014` `2015` `2016`## <chr> <chr> <dbl> <dbl> <dbl>## 1 China maize 5.81 5.89 5.97## 2 China potatoes 17.1 17.3 17.7 ## 3 India maize 2.61 2.60 2.62## 4 India potatoes 22.9 23.1 20.5 ## 5 Indonesia maize 4.95 5.18 5.31## 6 Indonesia potatoes 17.7 18.2 18.3 ## 7 Mexico maize 3.30 3.48 3.72## 8 Mexico potatoes 27.3 27.1 27.9 ## 9 Pakistan maize 4.32 4.42 4.55## 10 Pakistan potatoes 18.2 23.4 22.4 ## 11 United States maize 10.7 10.6 11.7 ## 12 United States potatoes 47.2 46.9 48.6Easy enough to rapidly prototype
Basic gt table
yield_data_wide %>% gt()Basic gt table
yield_data_wide %>% gt()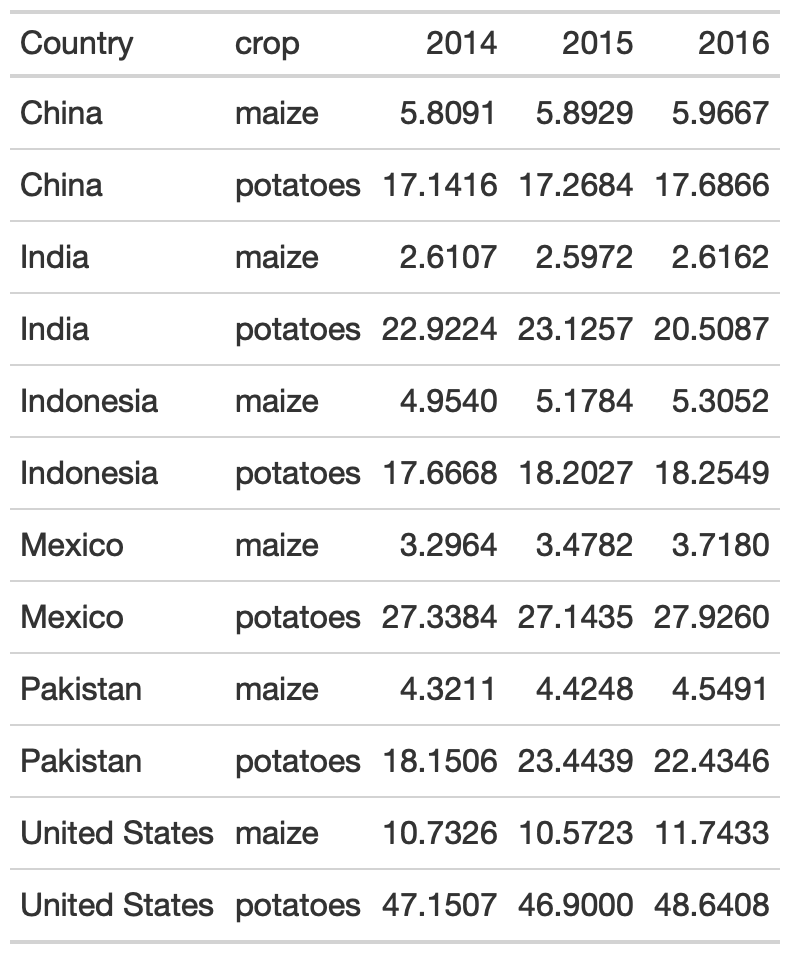
Add groups
yield_data_wide %>% head() %>% # respects grouping from dplyr group_by(Country) %>% gt(rowname_col = "crop")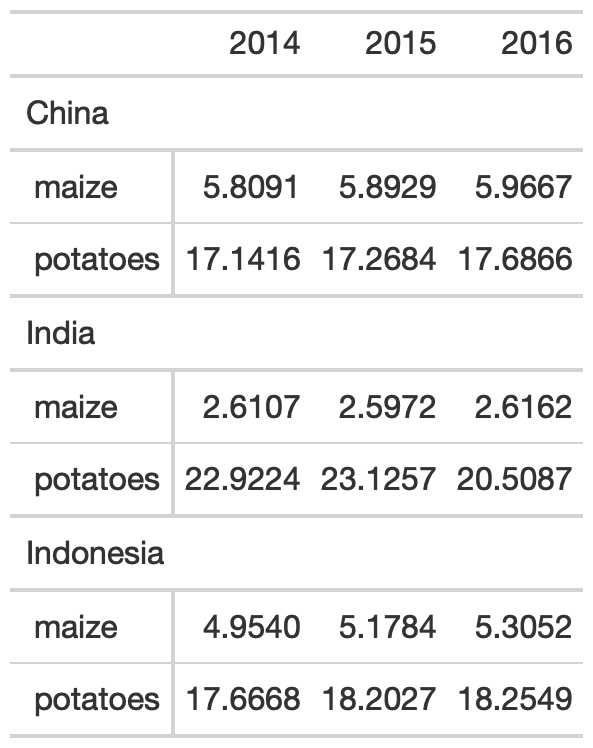
Add groups
yield_data_wide %>% head() %>% # respects grouping from dplyr group_by(Country) %>% gt(rowname_col = "crop")
yield_data_wide %>% head() %>% gt( groupname_col = "crop", rowname_col = "Country" )
Groups
yield_data_wide %>% mutate(crop = str_to_title(crop)) %>% group_by(crop) %>% gt( rowname_col = "Country" ) %>% fmt_number( columns = 2:5, # reference cols by pos decimals = 2 # decrease decimal places ) %>% summary_rows( groups = TRUE, # reference cols by name columns = vars(`2014`, `2015`, `2016`), fns = list( # add summary stats avg = ~mean(.), sd = ~sd(.) ) )Groups
yield_data_wide %>% mutate(crop = str_to_title(crop)) %>% group_by(crop) %>% gt( rowname_col = "Country" ) %>% fmt_number( columns = 2:5, # reference cols by pos decimals = 2 # decrease decimal places ) %>% summary_rows( groups = TRUE, # reference cols by name columns = vars(`2014`, `2015`, `2016`), fns = list( # add summary stats avg = ~mean(.), sd = ~sd(.) ) )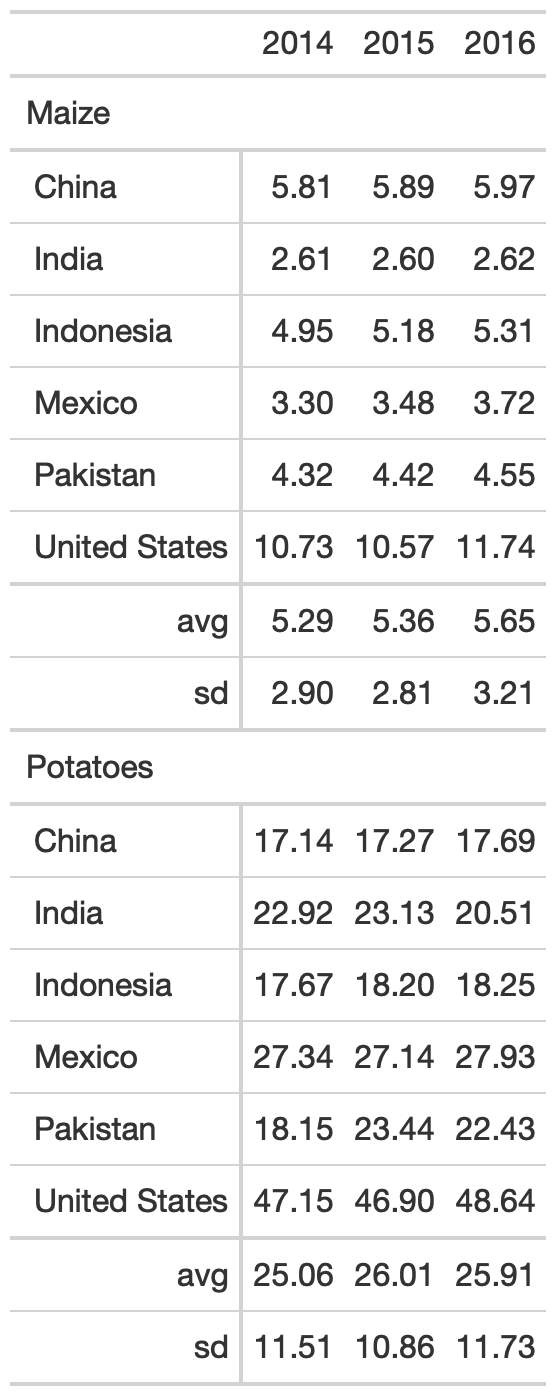
Add spanners
Table spanners can be added quickly with tab_spanner() and again use either position (column number) or + vars(name).
yield_data_wide %>% head() %>% gt( groupname_col = "crop", rowname_col = "Country" ) %>% tab_spanner( label = "Yield in Tonnes/Hectare", columns = 2:5 )Add spanners
Table spanners can be added quickly with tab_spanner() and again use either position (column number) or + vars(name).
yield_data_wide %>% head() %>% gt( groupname_col = "crop", rowname_col = "Country" ) %>% tab_spanner( label = "Yield in Tonnes/Hectare", columns = 2:5 )
Add notes and titles
Footnotes can be added with tab_footnote(). Note that this is our first use of the locations argument. Locations is used with things like cells_column_labels() or cells_body(), cells_summary() to offer very tight control of where to place certain changes.
yield_data_wide %>% head() %>% gt( groupname_col = "crop", rowname_col = "Country" ) %>% tab_footnote( footnote = "Yield in Tonnes/Hectare", locations = cells_column_labels( columns = 1:3 ) )Add notes and titles
Footnotes can be added with tab_footnote(). Note that this is our first use of the locations argument. Locations is used with things like cells_column_labels() or cells_body(), cells_summary() to offer very tight control of where to place certain changes.
yield_data_wide %>% head() %>% gt( groupname_col = "crop", rowname_col = "Country" ) %>% tab_footnote( footnote = "Yield in Tonnes/Hectare", locations = cells_column_labels( columns = 1:3 ) )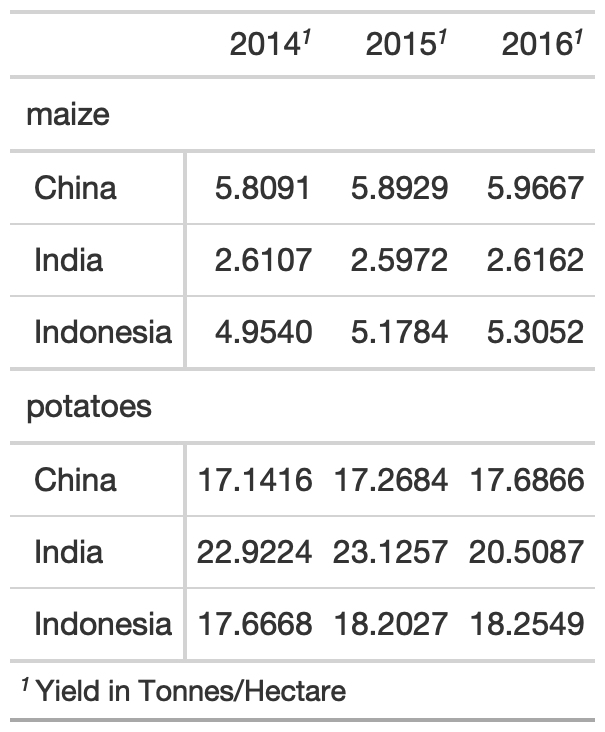
Add notes and titles
Footnotes can be added with tab_footnote(). Note that this is our first use of the locations argument. Locations is used with things like cells_column_labels() or cells_body(), cells_summary() to offer very tight control of where to place certain changes.
yield_data_wide %>% head() %>% gt( groupname_col = "crop", rowname_col = "Country" ) %>% tab_footnote( footnote = "Yield in Tonnes/Hectare", locations = cells_column_labels( columns = 1:3 # note ) ) %>% # Adding a `source_note()` tab_source_note( source_note = "Data: OurWorldInData" )Add notes and titles
Footnotes can be added with tab_footnote(). Note that this is our first use of the locations argument. Locations is used with things like cells_column_labels() or cells_body(), cells_summary() to offer very tight control of where to place certain changes.
yield_data_wide %>% head() %>% gt( groupname_col = "crop", rowname_col = "Country" ) %>% tab_footnote( footnote = "Yield in Tonnes/Hectare", locations = cells_column_labels( columns = 1:3 # note ) ) %>% # Adding a `source_note()` tab_source_note( source_note = "Data: OurWorldInData" )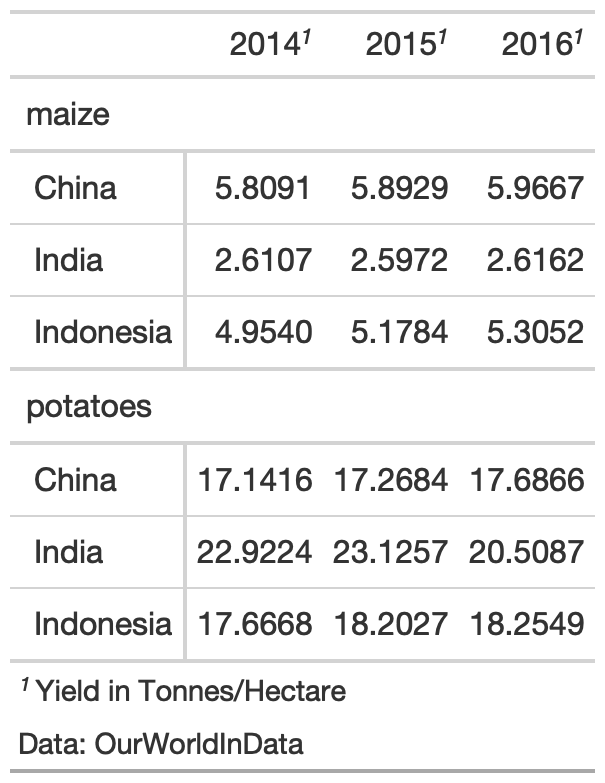
Add Title/Subtitle
Adding a title or subtitle with tab_header() and notice that I used md() around the title and html() around subtitle to adjust their appearance.
yield_data_wide %>% head() %>% gt( groupname_col = "crop", rowname_col = "Country" ) %>% tab_header( title = md("**Crop Yields between 2014 and 2016**"), subtitle = html("<em>Countries limited to Asia</em>") )Add Title/Subtitle
Adding a title or subtitle with tab_header() and notice that I used md() around the title and html() around subtitle to adjust their appearance.
yield_data_wide %>% head() %>% gt( groupname_col = "crop", rowname_col = "Country" ) %>% tab_header( title = md("**Crop Yields between 2014 and 2016**"), subtitle = html("<em>Countries limited to Asia</em>") )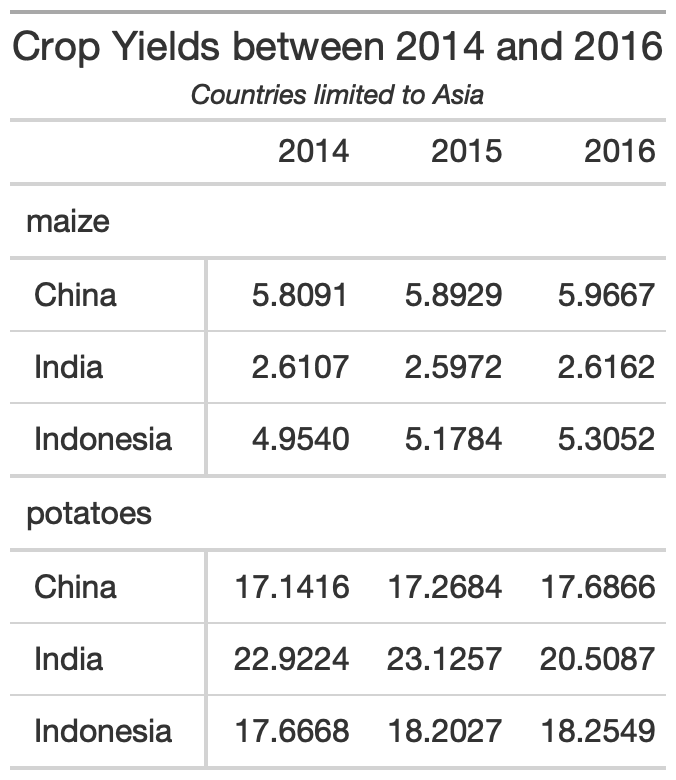
Adjust appearance
You can customize large chunks of the table appearance all at once via tab_options(). The full reference to ALL the options you can customize are in the gt packagedown site.
yield_data_wide %>% head() %>% gt( groupname_col = "crop", rowname_col = "Country" ) %>% tab_header( title = "Crop Yields between 2014 and 2016", subtitle = "Countries limited to Asia" ) %>% tab_options( heading.subtitle.font.size = 12, heading.align = "left", table.border.top.color = "red", column_labels.border.bottom.color = "red", column_labels.border.bottom.width= px(3) )Adjust appearance
You can customize large chunks of the table appearance all at once via tab_options(). The full reference to ALL the options you can customize are in the gt packagedown site.
yield_data_wide %>% head() %>% gt( groupname_col = "crop", rowname_col = "Country" ) %>% tab_header( title = "Crop Yields between 2014 and 2016", subtitle = "Countries limited to Asia" ) %>% tab_options( heading.subtitle.font.size = 12, heading.align = "left", table.border.top.color = "red", column_labels.border.bottom.color = "red", column_labels.border.bottom.width= px(3) )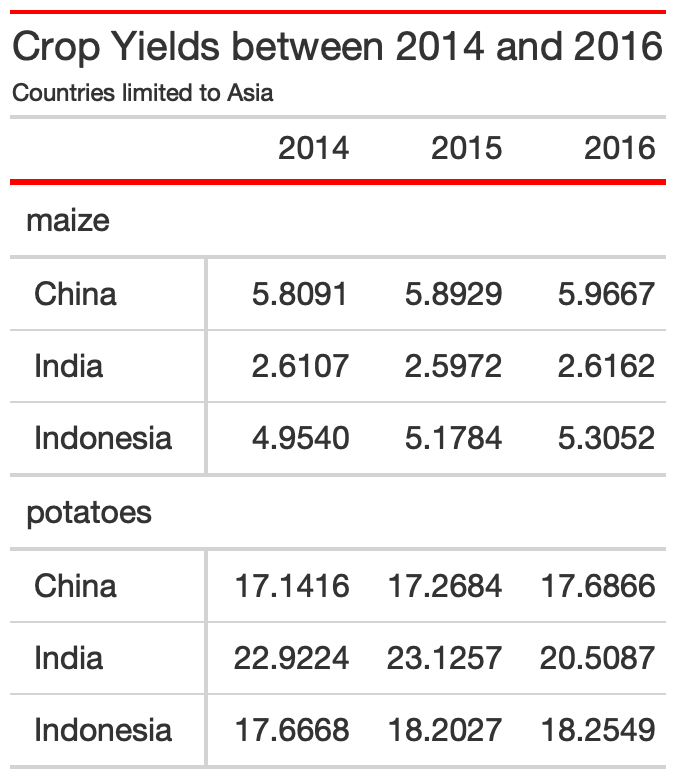
Pseudo-themes
Because gt is built up by a series of piped examples, you can also pass along additional changes/customization as a function almost like a ggplot2 theme!
my_theme <- function(data) { tab_options( data = data, heading.subtitle.font.size = 12, heading.align = "left", table.border.top.color = "red", column_labels.border.bottom.color = "red", column_labels.border.bottom.width= px(3) )}yield_data_wide %>% head() %>% gt( groupname_col = "crop", rowname_col = "Country" ) %>% tab_header( title = "Crop Yields between 2014 and 2016", subtitle = "Countries limited to Asia" ) %>% my_theme()Pseudo-themes
Because gt is built up by a series of piped examples, you can also pass along additional changes/customization as a function almost like a ggplot2 theme!
my_theme <- function(data) { tab_options( data = data, heading.subtitle.font.size = 12, heading.align = "left", table.border.top.color = "red", column_labels.border.bottom.color = "red", column_labels.border.bottom.width= px(3) )}yield_data_wide %>% head() %>% gt( groupname_col = "crop", rowname_col = "Country" ) %>% tab_header( title = "Crop Yields between 2014 and 2016", subtitle = "Countries limited to Asia" ) %>% my_theme()
Style specific cells w/ tab_style()
yield_data_wide %>% head() %>% gt() %>% tab_style( style = list( cell_text(weight = "bold") ), locations = cells_column_labels(everything()) ) %>% tab_style( style = list( cell_fill(color = "black", alpha = 0.2), cell_borders( side = c("left", "right"), color = "black", weight = px(2) ) ), locations = cells_body( columns = vars(crop) ) ) %>% tab_style( style = list( cell_text(color = "red", style = "italic") ), locations = cells_body( columns = 3:5, rows = Country == "China" ) )Style specific cells w/ tab_style()
yield_data_wide %>% head() %>% gt() %>% tab_style( style = list( cell_text(weight = "bold") ), locations = cells_column_labels(everything()) ) %>% tab_style( style = list( cell_fill(color = "black", alpha = 0.2), cell_borders( side = c("left", "right"), color = "black", weight = px(2) ) ), locations = cells_body( columns = vars(crop) ) ) %>% tab_style( style = list( cell_text(color = "red", style = "italic") ), locations = cells_body( columns = 3:5, rows = Country == "China" ) )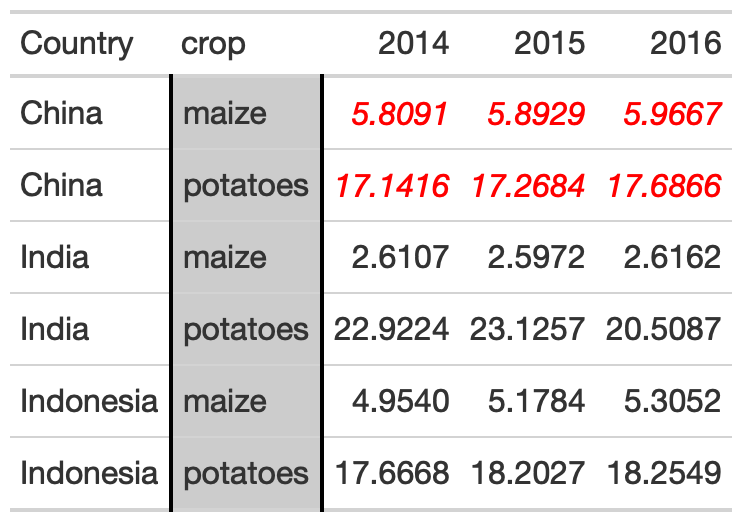
Color Gradient
my_pal <- scales::col_numeric( paletteer::paletteer_d( palette = "ggsci::red_material" ) %>% as.character(), domain = NULL )yield_data_wide %>% head() %>% gt( groupname_col = "crop", rowname_col = "Country" ) %>% data_color( columns = vars(`2014`, `2015`, `2016`), colors = my_pal )Color Gradient
my_pal <- scales::col_numeric( paletteer::paletteer_d( palette = "ggsci::red_material" ) %>% as.character(), domain = NULL )yield_data_wide %>% head() %>% gt( groupname_col = "crop", rowname_col = "Country" ) %>% data_color( columns = vars(`2014`, `2015`, `2016`), colors = my_pal )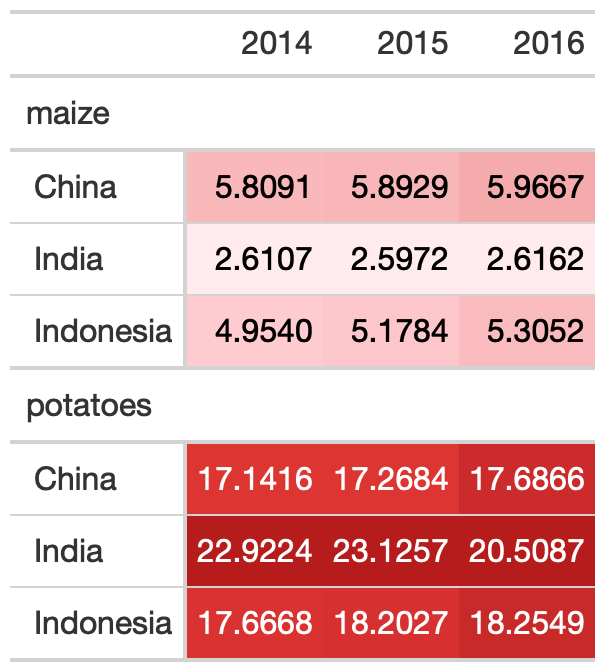
Powerful enough for final presentation
Themes
Themes are really just functions with a lot of the gt customizations baked in.
- They take raw data or
gtobjects, add styling/themes and then output the themed table - They can be reusable OR apply to specific data
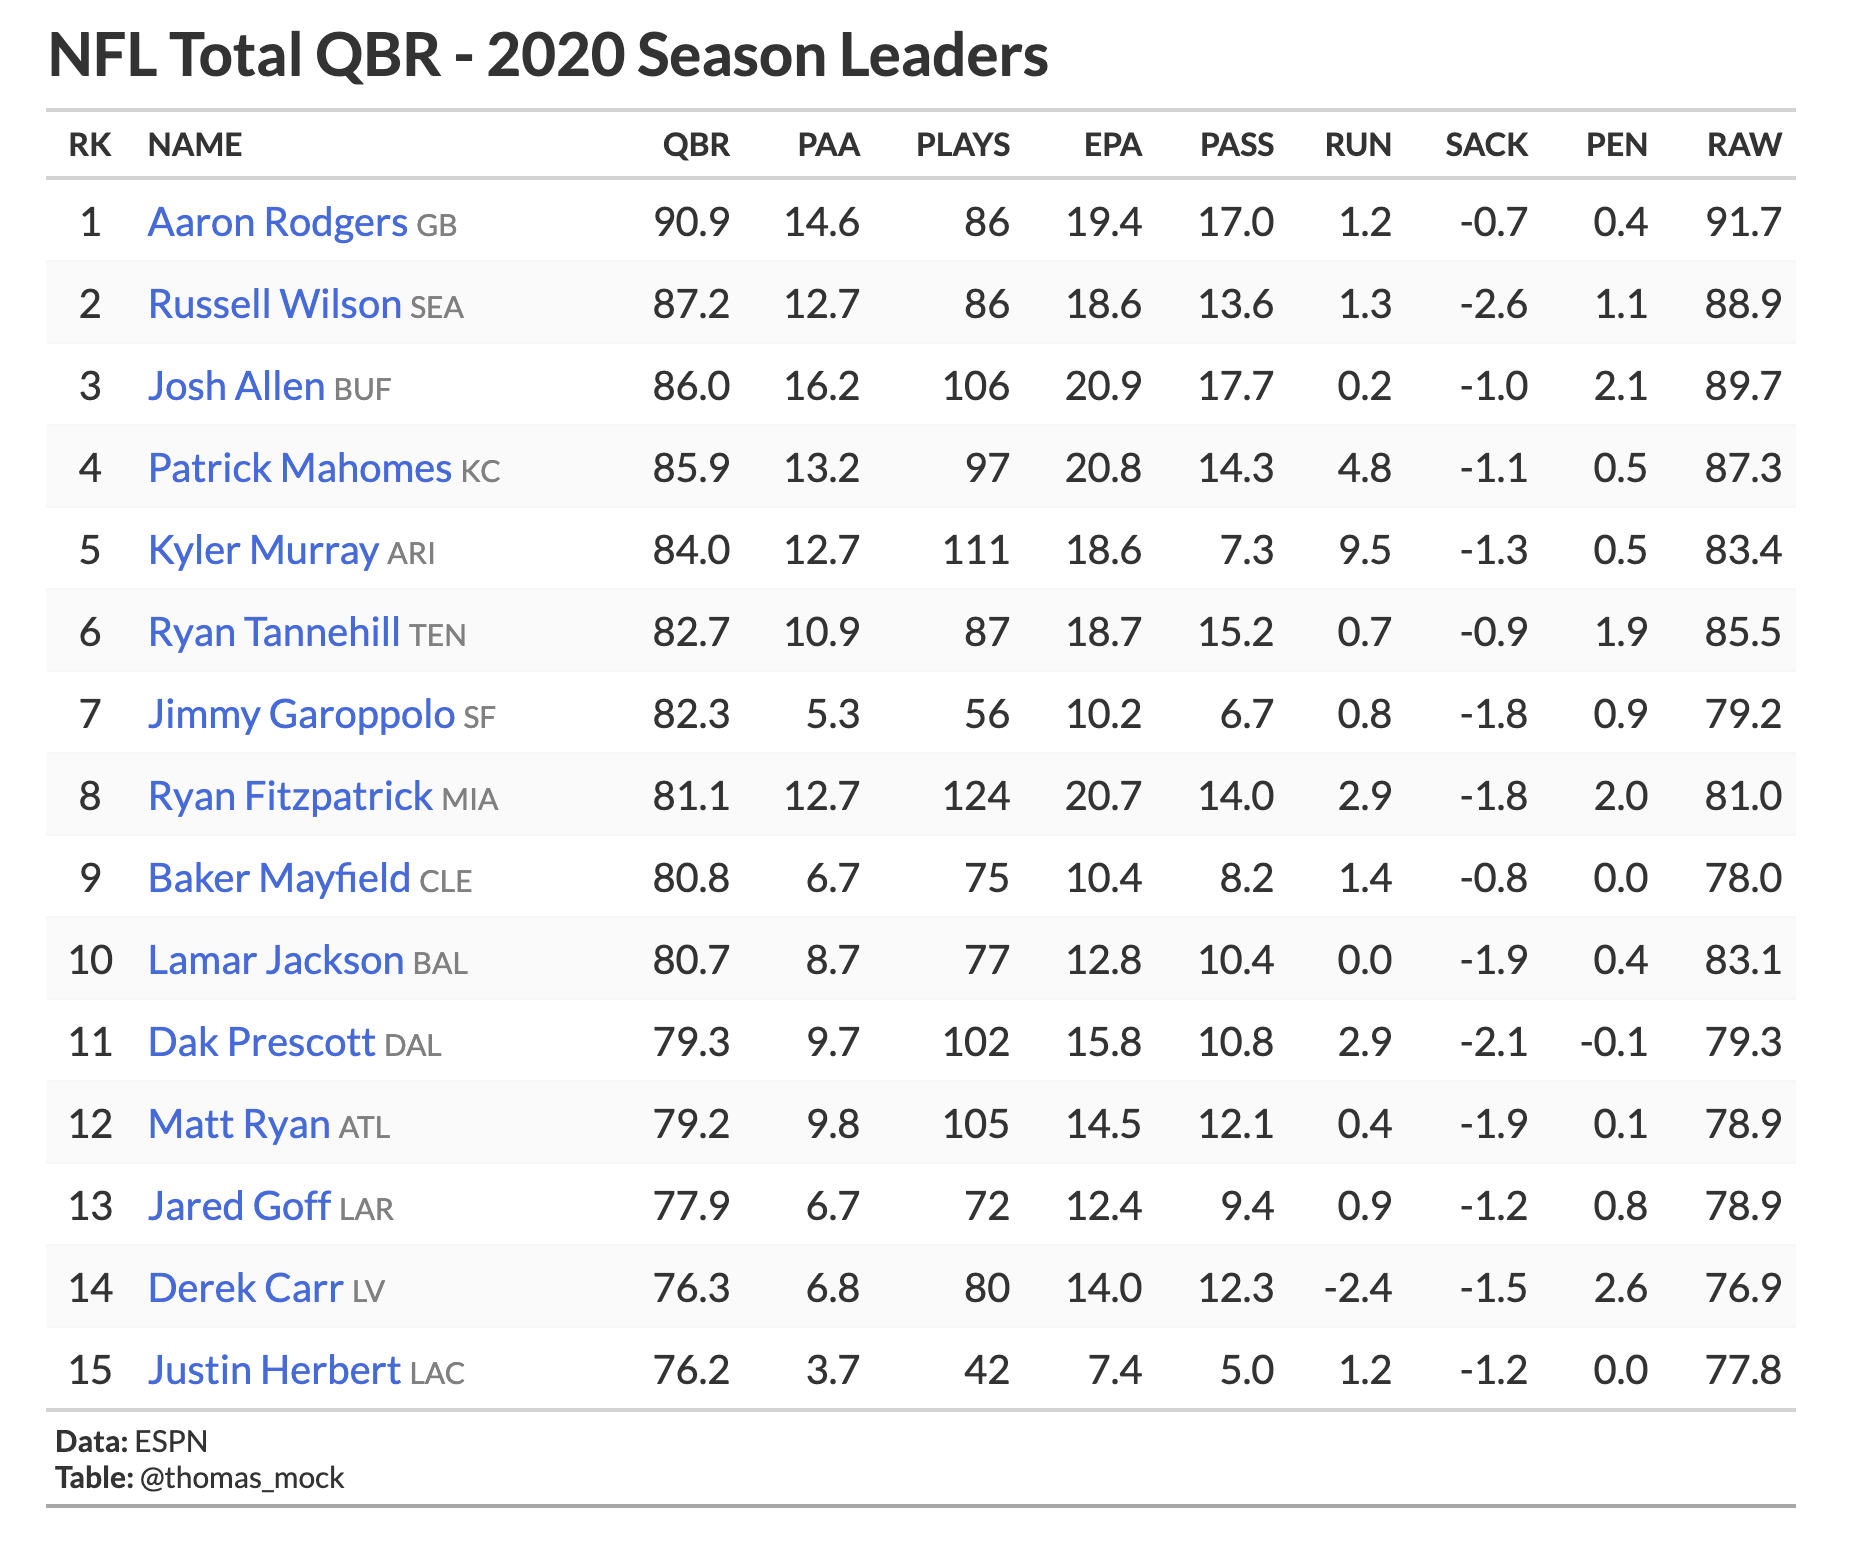
ESPN table
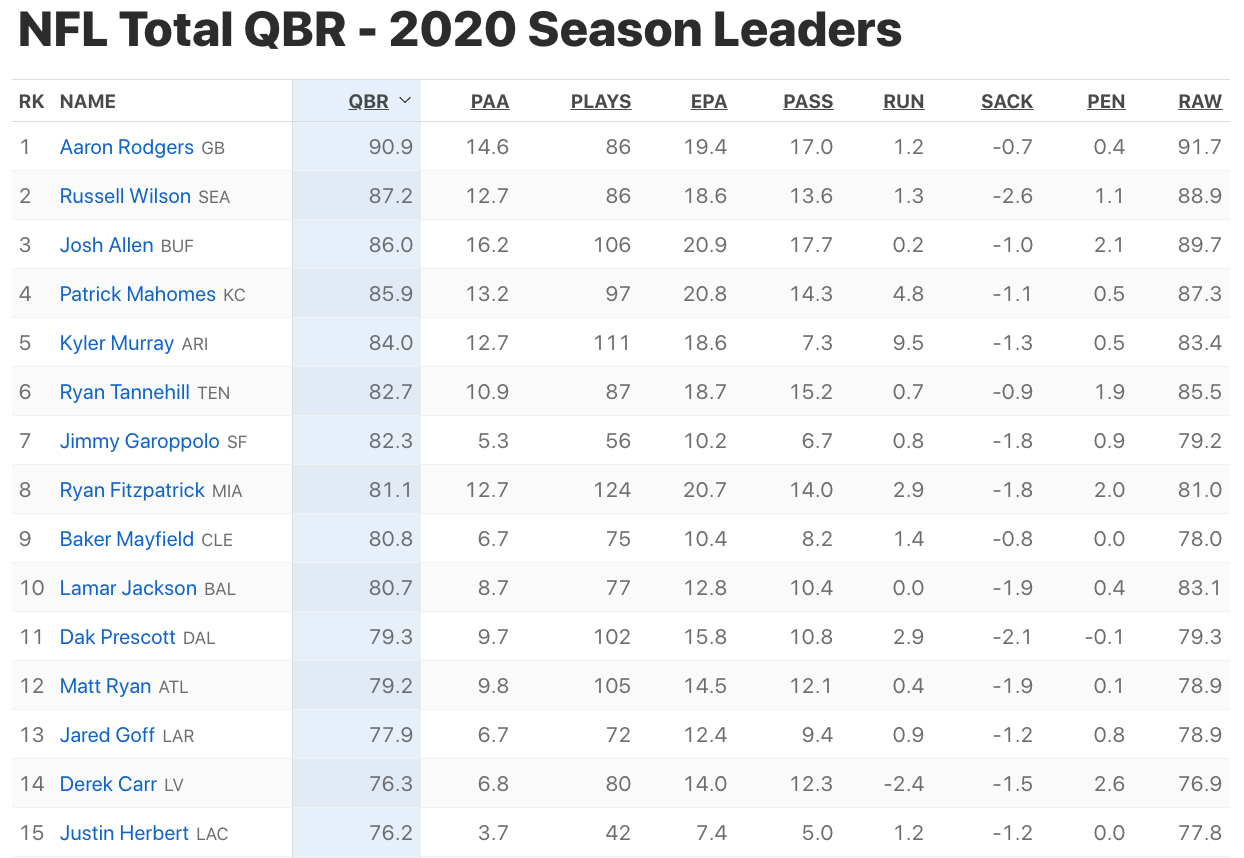
ESPN theme
gt_theme_espn <- function(data, ...){ data %>% opt_all_caps() %>% opt_table_font( font = list( google_font("Lato"), default_fonts() ) ) %>% opt_row_striping() %>% tab_options( row.striping.background_color = "#fafafa", table_body.hlines.color = "#f6f7f7", source_notes.font.size = 12, table.font.size = 16, table.width = px(700), heading.align = "left", heading.title.font.size = 24, table.border.top.color = "transparent", table.border.top.width = px(3), data_row.padding = px(7), ... ) }ESPN applied
FiveThirtyEight theme
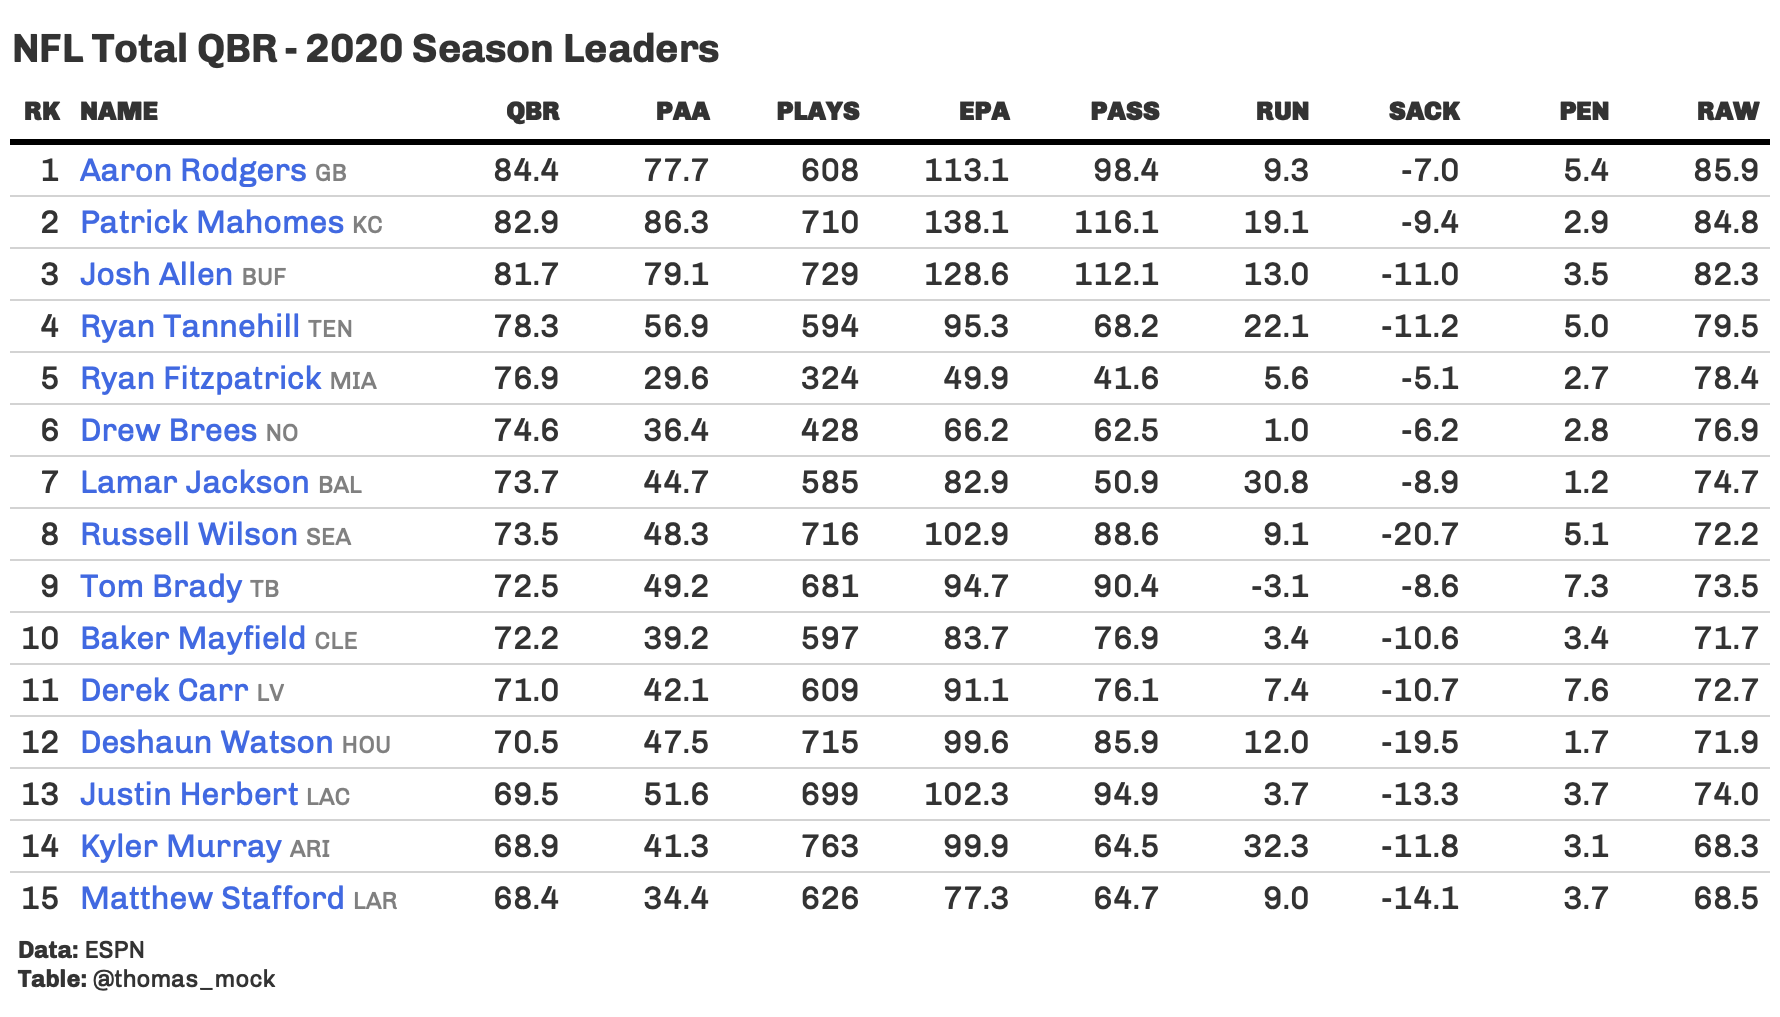
gt_theme_538 <- function(data,...) { data %>% opt_all_caps() %>% opt_table_font(font = list(google_font("Chivo"),default_fonts())) %>% tab_style(style = cell_borders(sides = "bottom", color = "transparent", weight = px(2)), locations = cells_body(columns = TRUE,rows = nrow(data$`_data`))) %>% tab_options( column_labels.background.color = "white", table.border.top.width = px(3), table.border.top.color = "transparent", table.border.bottom.color = "transparent", table.border.bottom.width = px(3), column_labels.border.top.width = px(3), column_labels.border.top.color = "transparent", column_labels.border.bottom.width = px(3), column_labels.border.bottom.color = "black", data_row.padding = px(3), source_notes.font.size = 12, table.font.size = 16, heading.align = "left", ... ) }FiveThirtyEight applied
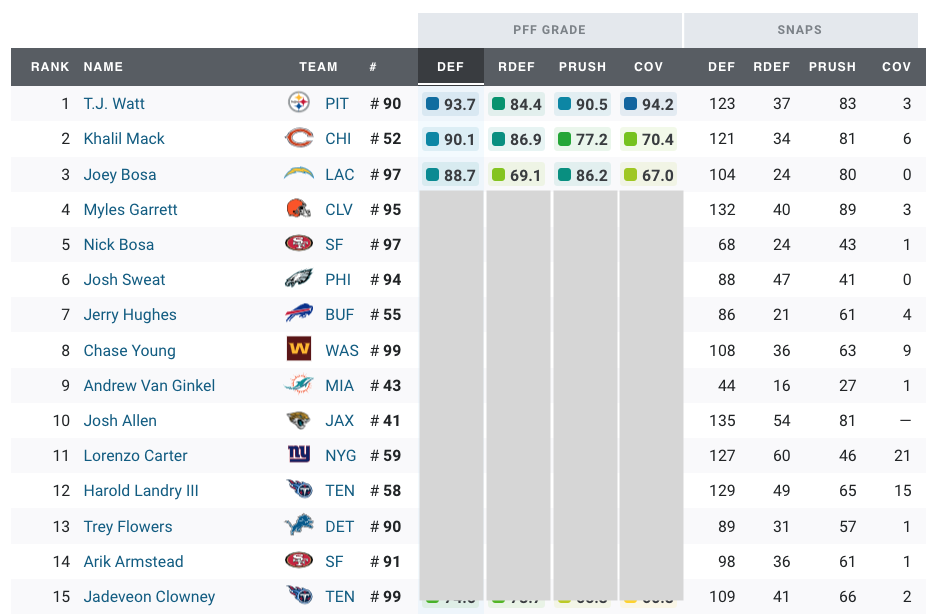
PFF Table
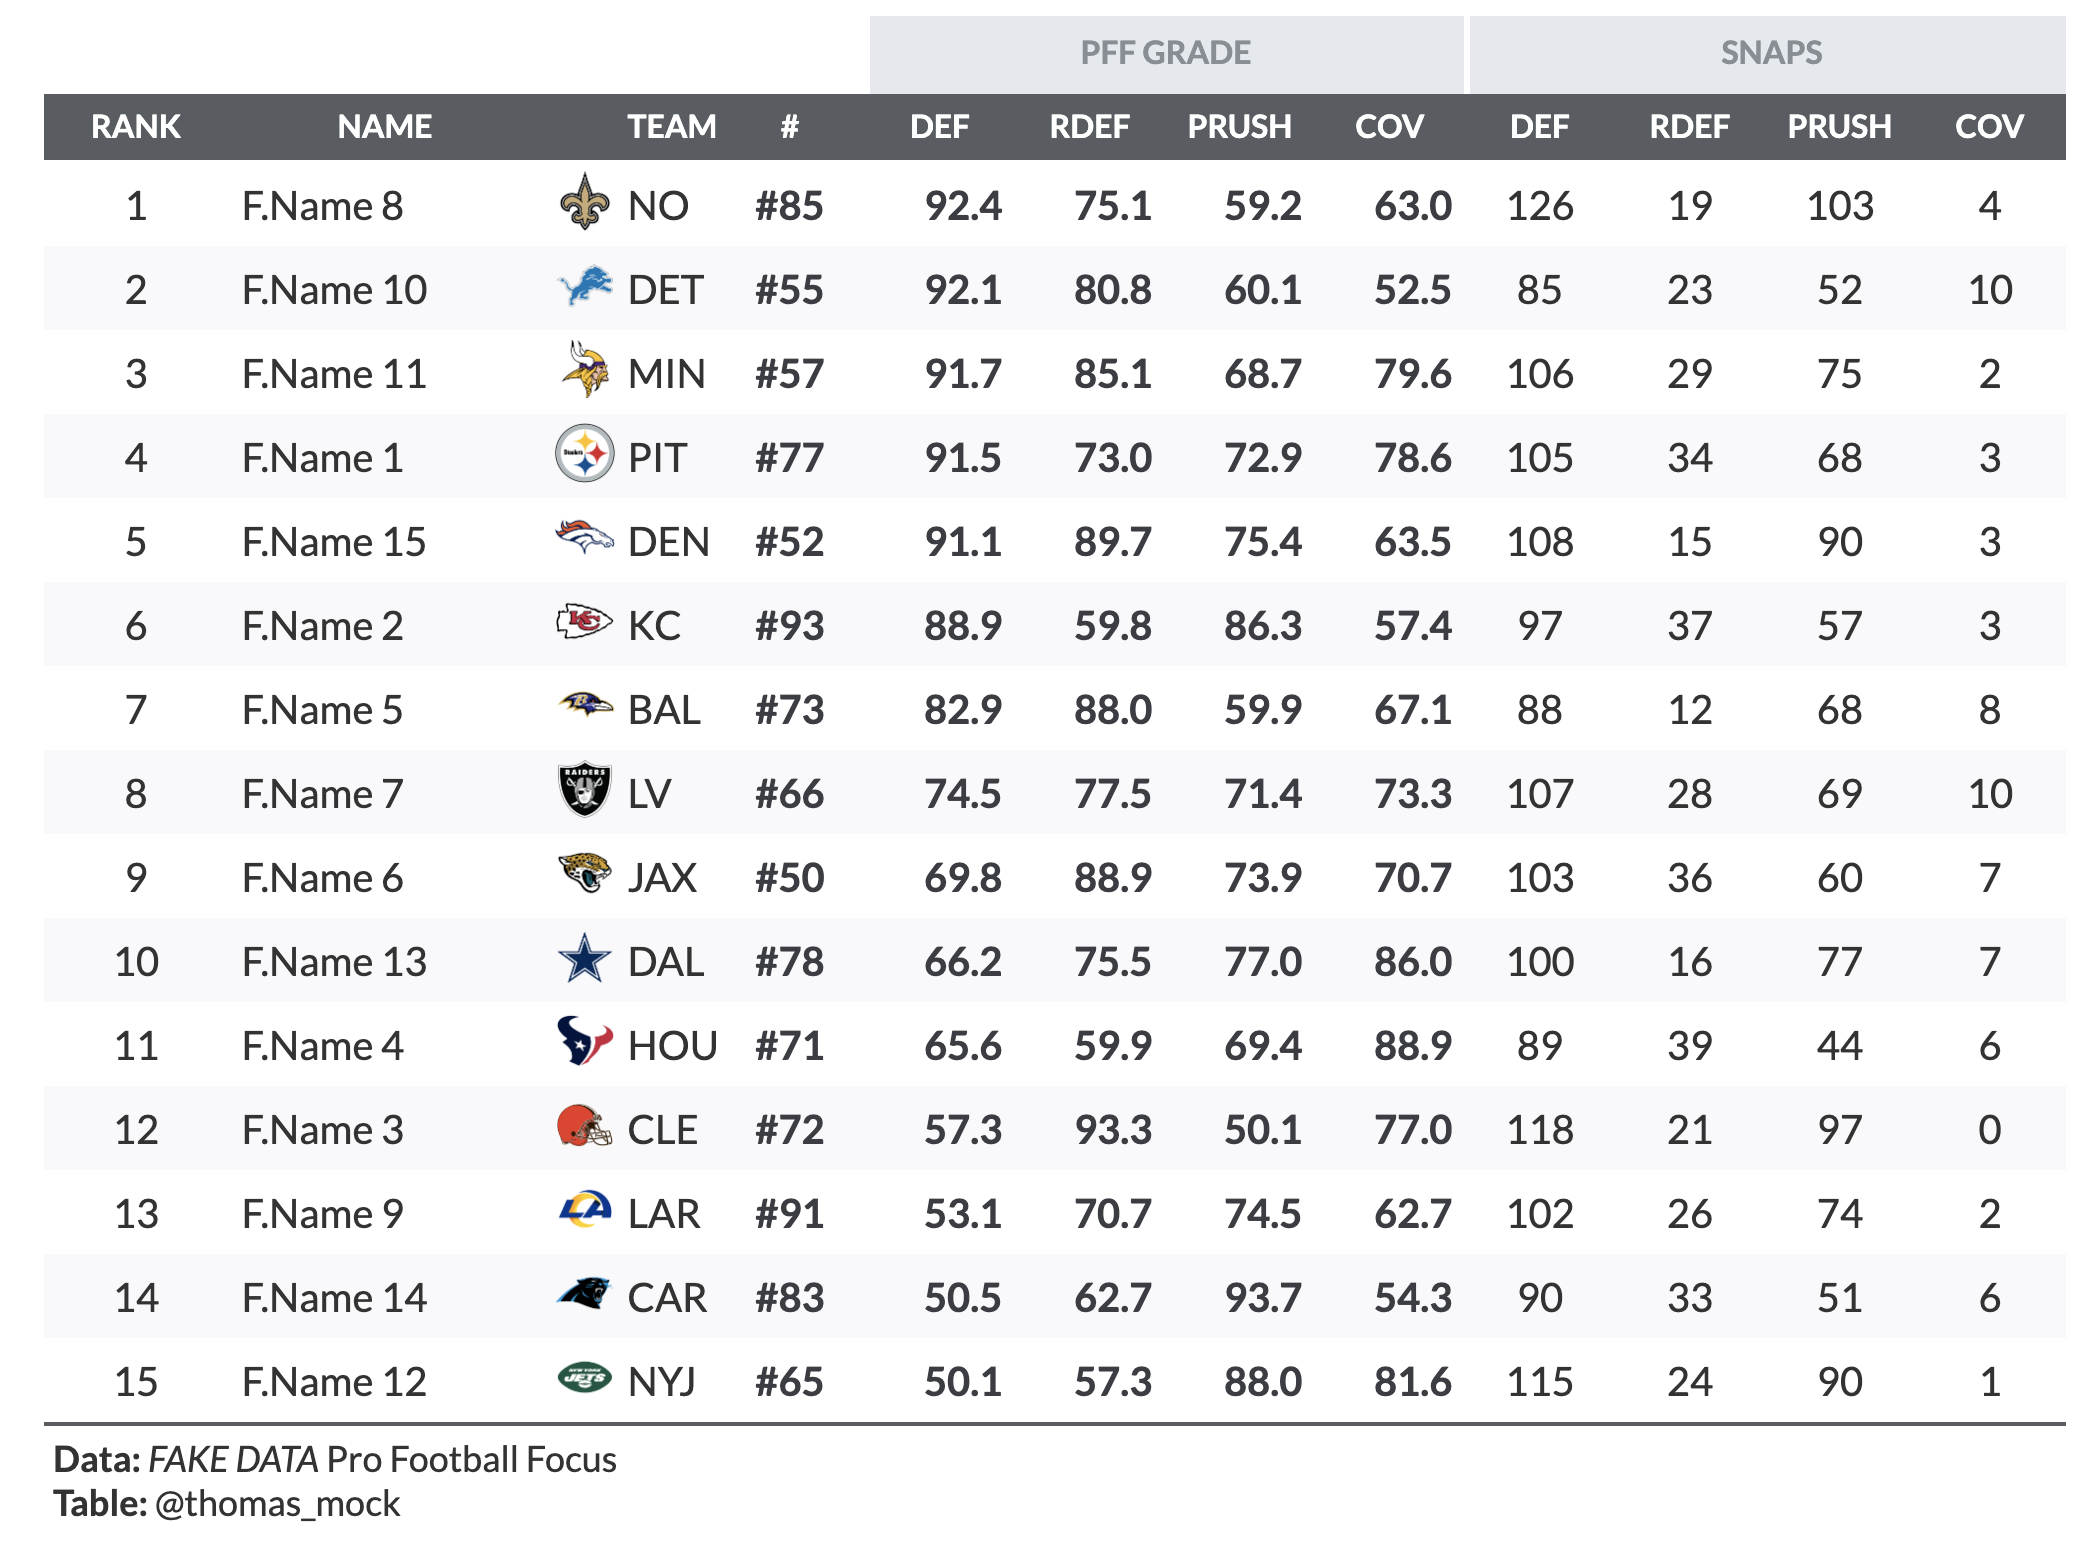
PFF Theme
Not going to show the code, because it really only applies to this table, but you can see it on my blog.
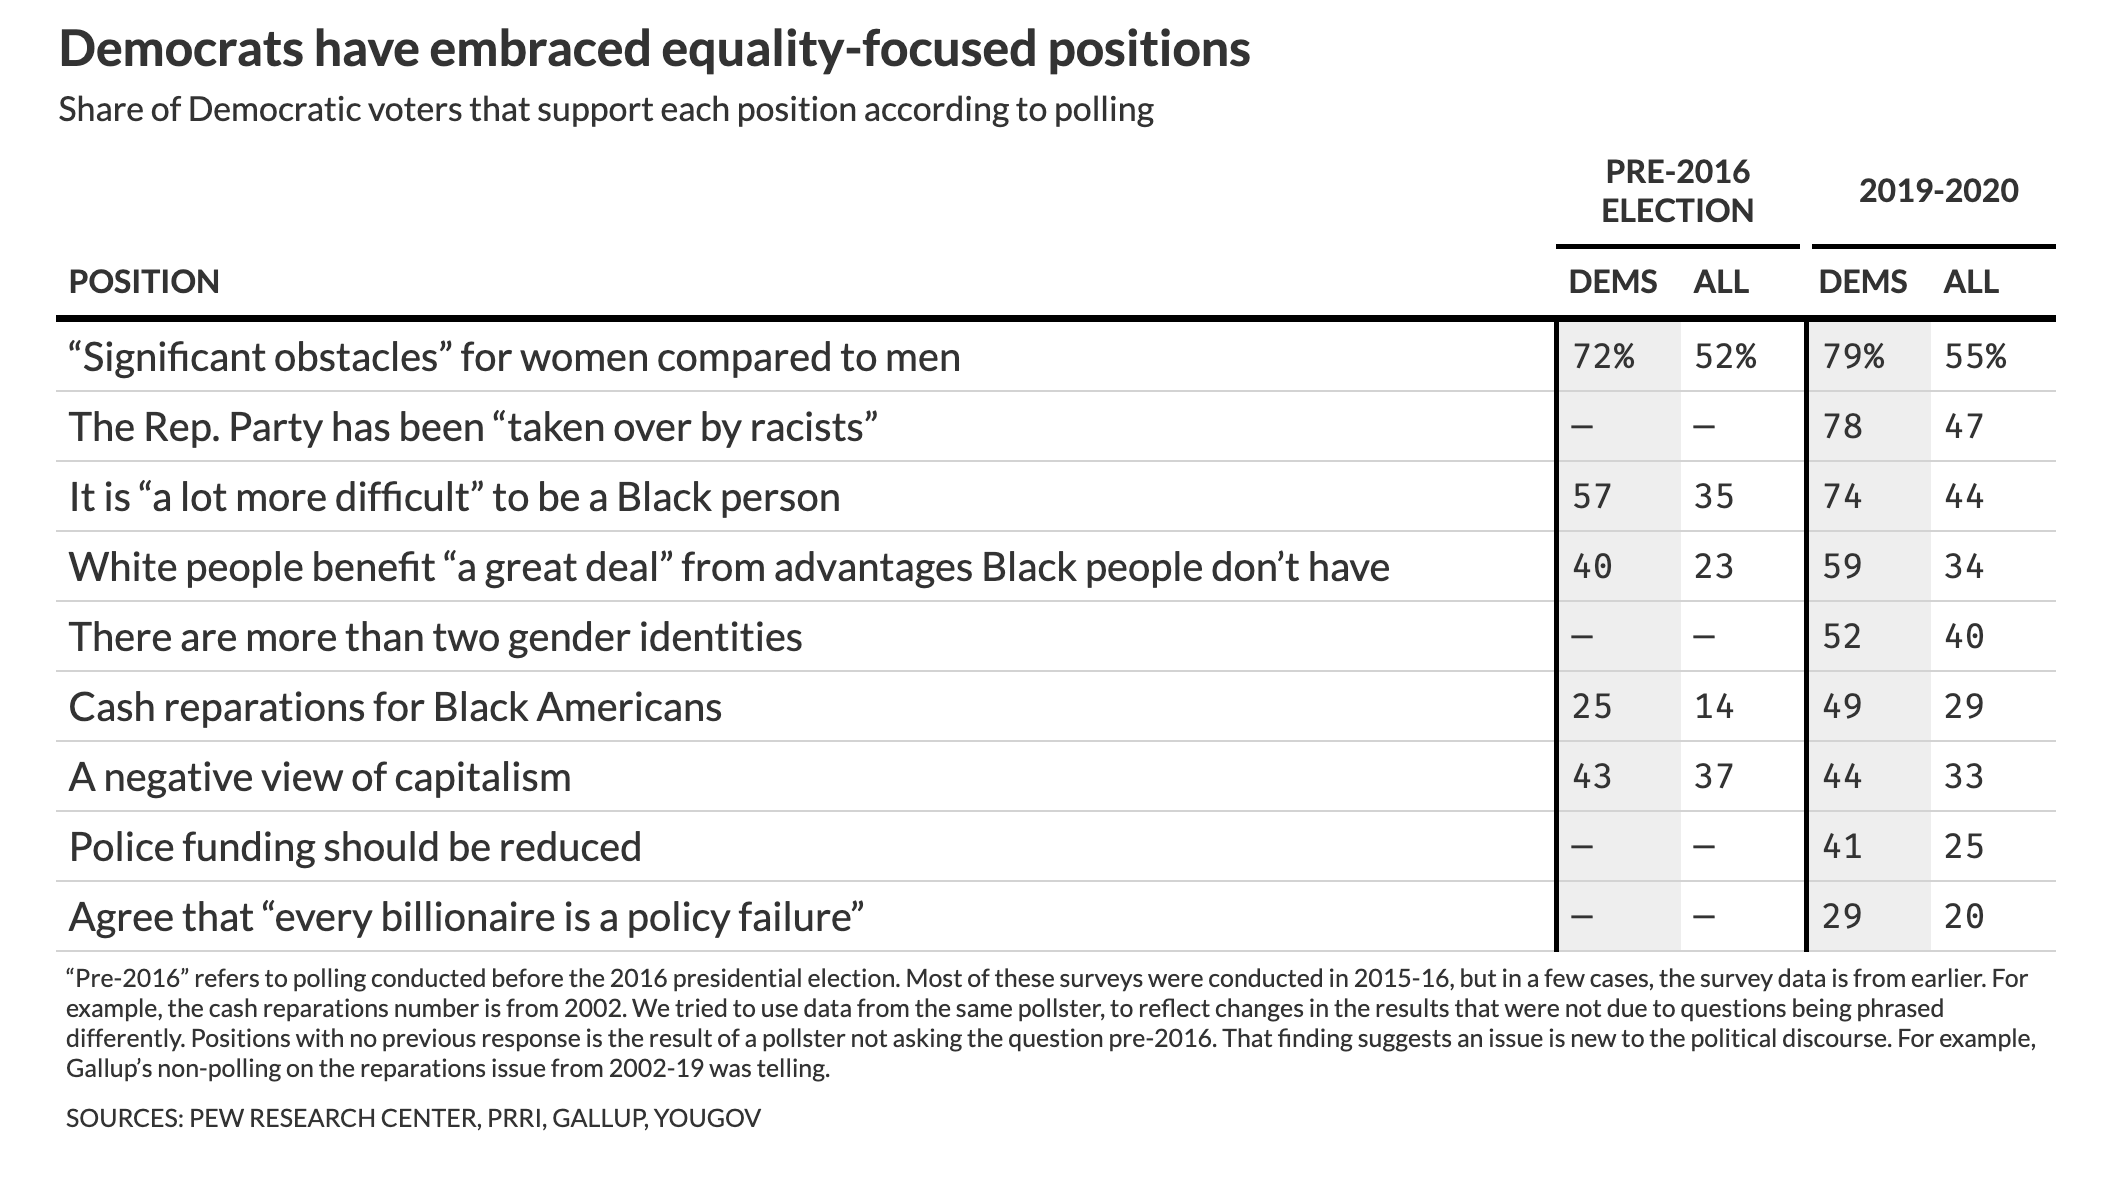
FiveThirtyEight (not sports)
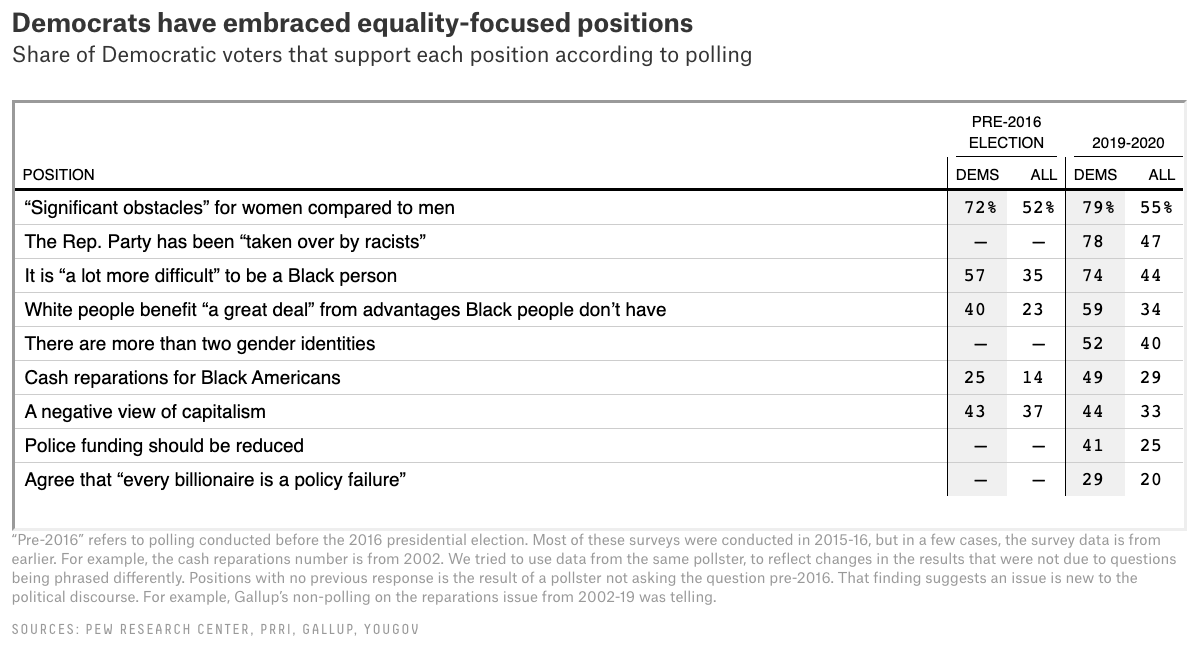
FiveThirtyEight (not sports)
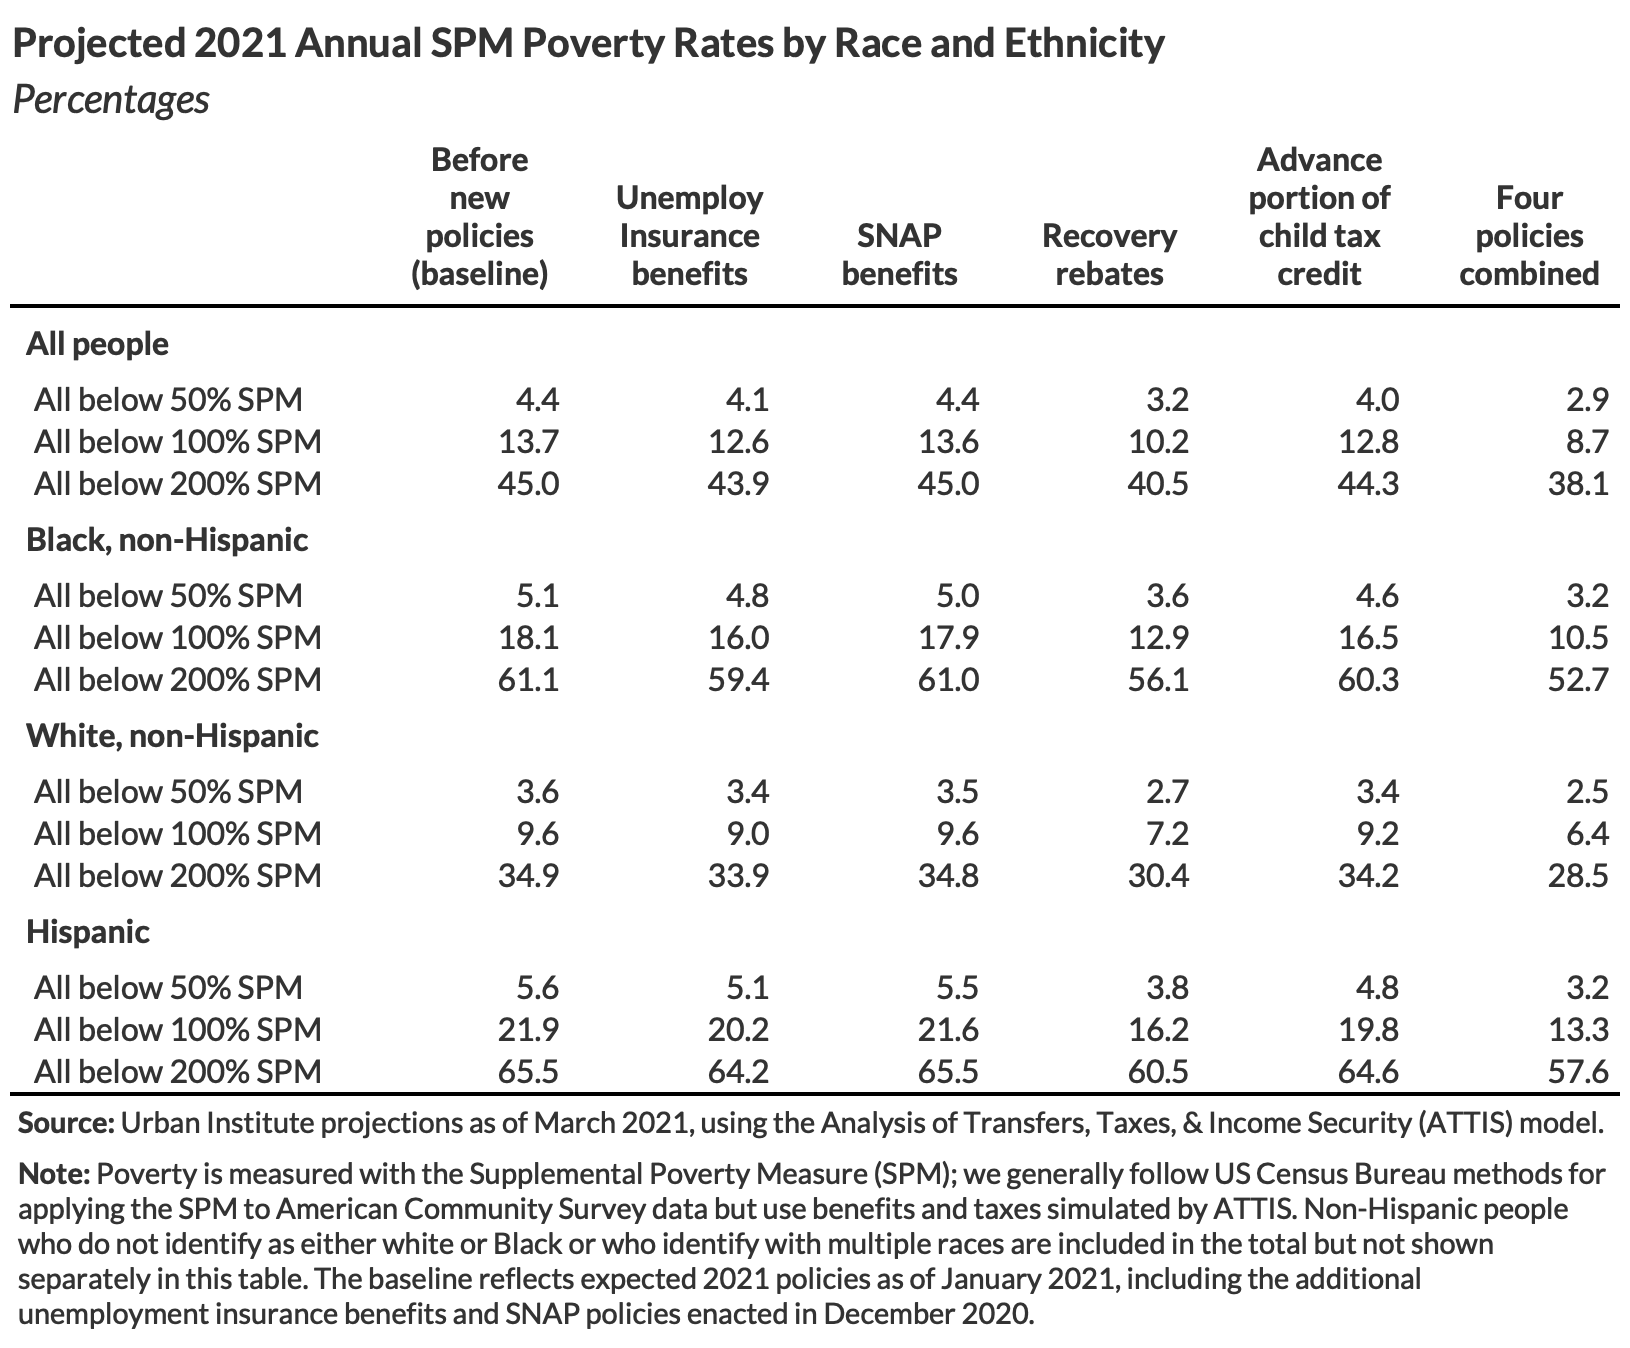
Urban
Advanced Features
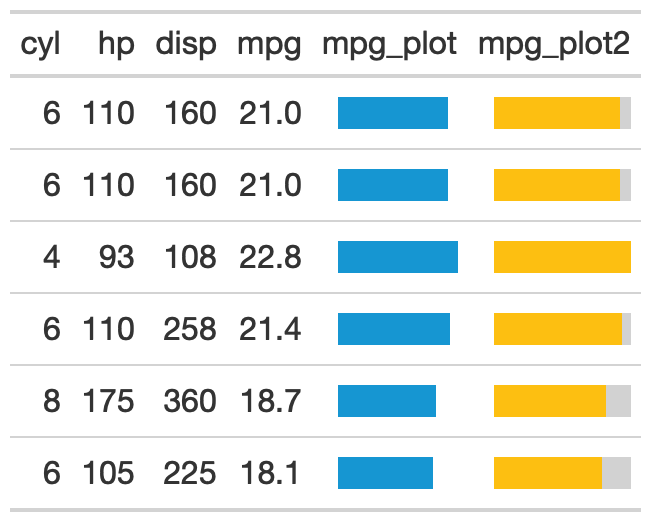
Bar plot
bar_chart <- function(label, height = "16px", fill = "#00bfc4", background = "white") { bar <- glue::glue("<div style='background:{fill};width:{label}%;height:{height};'></div>") chart <- glue::glue("<div style='flex-grow:1;margin-left:8px;background:{background};'>{bar}</div>") glue::glue("<div style='display:flex;align-items:left';>{chart}</div>") %>% gt::html()}head(mtcars) %>% mutate( mpg_val = mpg/max(mpg) * 100, mpg_plot = purrr::map(mpg_val, ~bar_chart(label = .x, fill = "#1696d2")), mpg_plot2 = purrr::map(mpg_val, ~bar_chart(label = .x, fill = "#fdbf11", background = "#d2d2d2")), ) %>% select(cyl, hp, disp, mpg, mpg_plot, mpg_plot2) %>% gt() %>% cols_align(align = "left", columns = vars(mpg_plot))Bar plot
Sparklines
gt_plot <- function(table_data, column, plot_data, plot_fun, color = "#1696d2",...){ text_transform( table_data, # note the use of {{}} here - this is tidy eval # that allows you to indicate specific columns locations = cells_body(columns = vars({{column}})), fn = function(x){ plot <- purrr::map( plot_data, plot_fun, width = 300, height = 70, same_lim = TRUE, col = color, minmax = list(pch = 18, col = "#fdbf11"), ...) plot_svg <- purrr::map(plot, "svg_text") purrr::map(plot_svg, gt::html) } )}mpg_list <- split(mtcars$mpg, mtcars$cyl)tibble(cyl = c(4,6,8), boxplot = "") %>% gt() %>% gt_plot( column = boxplot, # column to create plot in plot_data = mpg_list, # external data to reference plot_fun = kableExtra::spec_plot, # which plot fun ylim = range(mtcars$mpg), # range applied, color = "#1696d2", # change color of line cex = 5 # change size of points, )Sparklines
library(kableExtra)mpg_rng <- range(mtcars$mpg)tibble(cyl = c(4, 6, 8), boxplot = "", mpg_hist = "", mpg_line1 = "", mpg_line2 = "", mpg_points1 = "", mpg_points2 = "", mpg_poly = "") %>% gt() %>% gt_plot(column = boxplot, plot_data = mpg_list, plot_fun = spec_boxplot, lim = mpg_rng) %>% gt_plot(column = mpg_hist, plot_data = mpg_list, plot_fun = spec_hist, lim = mpg_rng) %>% gt_plot(column = mpg_line1, plot_data = mpg_list, plot_fun = spec_plot, ylim = mpg_rng) %>% gt_plot(column = mpg_line2, plot_data = mpg_list, plot_fun = spec_plot) %>% gt_plot(column = mpg_points1, plot_data = mpg_list, plot_fun = spec_plot, type = "p", ylim = mpg_rng, cex = 4) %>% gt_plot(column = mpg_points2, plot_data = mpg_list, plot_fun = spec_plot, type = "p", cex = 4) %>% gt_plot(column = mpg_poly, plot_data = mpg_list, plot_fun = spec_plot, polymin = 5, ylim = mpg_rng)Sparklines
library(kableExtra)mpg_rng <- range(mtcars$mpg)tibble(cyl = c(4, 6, 8), boxplot = "", mpg_hist = "", mpg_line1 = "", mpg_line2 = "", mpg_points1 = "", mpg_points2 = "", mpg_poly = "") %>% gt() %>% gt_plot(column = boxplot, plot_data = mpg_list, plot_fun = spec_boxplot, lim = mpg_rng) %>% gt_plot(column = mpg_hist, plot_data = mpg_list, plot_fun = spec_hist, lim = mpg_rng) %>% gt_plot(column = mpg_line1, plot_data = mpg_list, plot_fun = spec_plot, ylim = mpg_rng) %>% gt_plot(column = mpg_line2, plot_data = mpg_list, plot_fun = spec_plot) %>% gt_plot(column = mpg_points1, plot_data = mpg_list, plot_fun = spec_plot, type = "p", ylim = mpg_rng, cex = 4) %>% gt_plot(column = mpg_points2, plot_data = mpg_list, plot_fun = spec_plot, type = "p", cex = 4) %>% gt_plot(column = mpg_poly, plot_data = mpg_list, plot_fun = spec_plot, polymin = 5, ylim = mpg_rng)
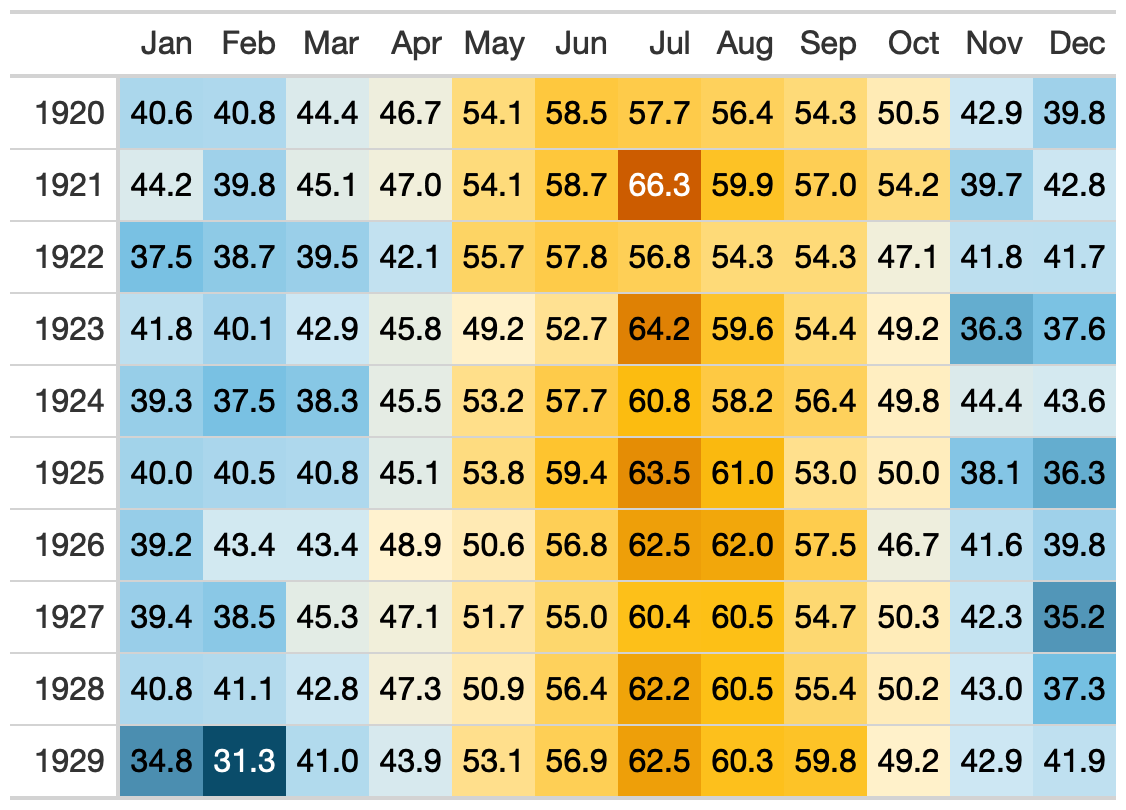
Heatmap
dimnames <- list(start(nottem)[1]:end(nottem)[1], month.abb)temps <- matrix(nottem, ncol = 12, byrow = TRUE, dimnames = dimnames) %>% data.frame() %>% tibble::rownames_to_column() %>% head(10)temps %>% gt() %>% data_color( columns = vars(month.abb), colors = scales::col_numeric( c("#0a4c6a", "#73bfe2", "#cfe8f3", "#fff2cf", "#fdd870", "#fdbf11", "#ca5800"), domain = range(nottem)) )Heatmap
Icons
icon_fun <- function(icon, fill, val){ fontawesome::fa(icon, fill = fill) %>% rep(., val) %>% gt::html()}head(mtcars) %>% select(mpg:drat) %>% mutate(cylinder = paste(cyl, "cyl"), .before = cyl) %>% gt() %>% text_transform( locations = cells_body(columns = vars(cyl), rows = cyl == 4), fn = function(x){icon_fun(icon = "truck-pickup", fill = "black", val = x)} ) %>% text_transform( locations = cells_body(columns = vars(cyl), rows = cyl == 6), fn = function(x){gt::html(rep(fontawesome::fa("truck", fill = "#fdbf11"), 6))} ) %>% text_transform( locations = cells_body(columns = vars(cyl), rows = cyl == 8), fn = function(x){icon_fun(icon = "truck-monster", fill = "#1696d2", val = x)} ) %>% cols_align(align = "left", columns = vars(cyl)) %>% cols_width(vars(cyl)~px(170)) %>% tab_source_note( source_note = html("<img height='30px' src='https://nchousing.org/wp-content/uploads/2017/04/logo.png' style='float: right;'></img>") )Icons
![]()
When NOT to use gt
Data too long
- MAYBE Consider going horizontal
- Probably better to use interactive table (
reactable) - Possibly better to use a graphic
Data too long
- MAYBE Consider going horizontal
- Probably better to use interactive table (
reactable) - Possibly better to use a graphic
Avoid the "CVS receipt"!

Complex PDF Tables (or Word)
LaTeX support in gt is still in progress, so while it can "just work" in PDF, HTML content is still where it shines
- PDF can work via
webshot, seegtsave("TAB-NAME.pdf") - Basic tables in PDF work ok, but I'd recommend
kableExtraorkablefor now - For Word, you can copy paste RTF
gttables, but I still think thatflextablewins the "Office" wars pagedownandpagedreportare very powerful for HTML -> PDF
Resources
7 Different Table Guides on TheMockUp.blog
ALL code for this specific presentation in written form on my github
{gt}documentationThe
{gt}Cookbook and the Advanced Cookbook
